Global Warming Denial - Spinning the Scales
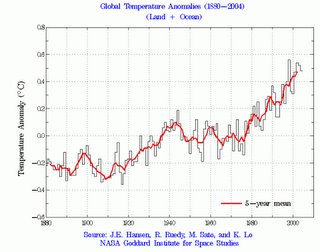
| Climate change data can be analyzed at various time scales, opening up many possibilites for spinning out desired conclusions. In an opinion piece in the Sunday Telegraph, Bob Carter, an Australian geologist presents a surprising result gleaned from the record of temperature anomalies: "There IS a problem with global warming... it stopped in 1998". Focusing only on the eight years since 1998 (the hottest year on record), Carter points out that there has been zero net increase in that time. Lets see how these data look in a slightly larger time scale (the scale actually used in the study he references): Note the year 2000 on the x-axis. Look up to the temperature data and see the 1998 high point just to the left. Focus only on the time going forward from that point. Nothing to worry about, right? Carter correctly points out that "Climate changes naturally all the time, partly in predictable cycles, and partly in unpredictable shorter rhythms and rapid episodic shifts...". Might this insight lead him to urge us to look to larger scale trends, like the one portrayed in the study he highlights? Well, not really. "Two simple graphs provide needed context, and exemplify the dynamic, The past six million years is an irrelevant time span. Global climate concerns are not focused on the possibility that we might soon see the hottest temperatures in the history of Earth. The concern is that we will see human-caused (and thus potentially avoidable) warming of a magnitude that will be devastating to the ecosystem as it exists today, and to the infrastructure and social organization of human civilization as it has developed these past few thousand years. And by focusing on only the past eight years we necessarily encounter the short-term noise around the trend lines that are so evident on the graph, and that Carter himself seems to acknowledge with his reference to "rapid episodic shifts". The appropriate time scale would be one that plots the changes that have occurred since humans have had the power to affect the atmosphere in dramatic fashion - the industrial age. The graph above comes close to approximating that scale. Comparing these trends to historical changes, over similar scales, can indicate whether the magnitude of current changes is normal or not. But focusing only on the very short, or the very long time scale does nothing but avoid the real issues. Global Warming Climate Change Science |


3 Comments on "Global Warming Denial - Spinning the Scales"
I just have too many memories about the fear during the 1970's that we were going into an Ice Age to take this seriously.
You also had little or nothing to say about the ability (or lack thereof) of science to attribute this change to human activity.
Please read it and then drop by my blog to let me know your response.
You left a comment on my own post recently - I would be interested to hear your take.